- Francis Galton known as father of biostatistics
- Measures of Central Tendency: Average, Mean, Median and Mode
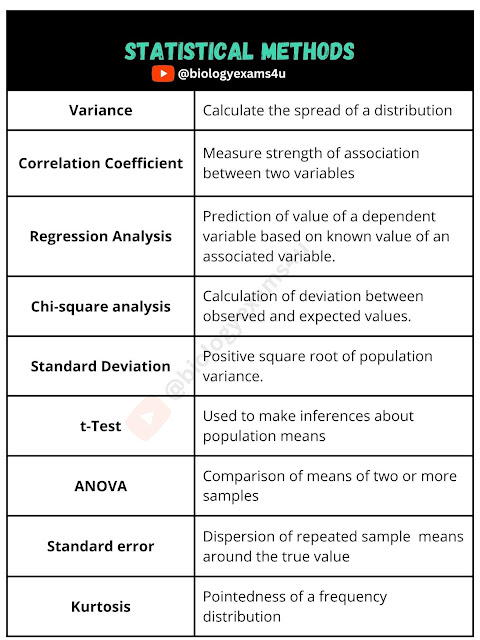
- Stastics of Dispersion: Mean deviation, Standard deviation and Variance
- Mean deviation about mean enables us to compare the variability of two or more sets of data
- The mean, median and mode are same in Normal distribution.
- In a normal distribution, the quartile deviation, the mean deviation about mean and the standard deviation are approximately 10:12:15.
- SPSS stands for Statistical Package for Social Services
- Chi-square test is applied when theoretical frequency is at least 10 or above 10
- The smaller the p-value, the more strongly the data contradict null hypothesis.
- A powerful statistical procedure for determining if differences in means are significant and for dividing variance into components is called ANOVA
- Measure of dispersion: Variance ,Range , Standard deviation
- The statistical tool employed to validate the statement - places having high levels of carbon monoxide leads to carboxy hemoglobin tragedy in humans - Pearson correlation coefficient
- Theoretical Probability Distributions is of three type: Normal, Biomial and Poisson
- A weed is assumed to be dispersed randomly in a meadow. What statistical distribution will describe the dispersion correctly- Poisson
- Poisson probability distribution provides a close approximation to binomial probability distribution, when ‘n’ is large and p is quite small or quite large’
- The correlation between two variables is strongest and linear when The value is 1.
- A relationship between two variables, in which a change in one variable results in change in other variables, is called Correlation
- F TEST statstial tool is used to test if the standard deviations of two populations are equal.
- Continuous variable are represented by Histogram.
- The standard deviation of the data is 6. When each observation is increased by 1, the standard deviation of the new data is 6
- Estimating or predicting the unknown values of one variable from the known values of another variable: Regression analysis
- Numerical test used to assess the significance of a deviation: T-test , X 2 test , F test
- Bar diagram is used for comparison between two or more variables.
- Histogram graph that contains frequencies in the form of vertical rectangles
- A pie chart or circle graph can be used to display: Quantitive data and Qualitative data.
- Variation in two characters in two or more species can be best represented by Scattered Diagram
In Chi-square analyses
- A prior estimate of the outcome is necessary.
- Differences between the expected and observed values decide the truthfulness of the experiment.

Normal and Poisson distributions
In normal distribution the basic shape is always symmetric, while in a Poisson distribution it changes.
- A Poisson distribution is discrete while a normal distribution is continuous.
- A Poisson random variable is always >= 0.
- Percentage frequency distribution is represented by Pie diagram
- Mode can be located graphically with the help of Histogram
Chi-Square test
- This test is used to determine if a certain distribution differs from some predetermined theoretical distribution
- Used in testing 'goodness of fit'
- Used in testing hypothesis concerning the significance of difference of the responses of two or more groups to the effect of treatment of one or other
Normal (Gaussian) distribution
- A symmetrical bell-shaped curve
- The mean, mode and median all coincide at the exact midpoint of distribution
- Tails of the curve get closer and closer to the axis as you move away from the mean
- The extend of the error bar in a graphical representation of data indicates The extent of variation within the raw data
- The graph you would expect when the co-relation constant between two variables is 1, is A straight line at 450 to the X axis starting from the origin
- The Chi-square test is used to analyse Differences between observed and expected values
- When the significance of the outcome of an experiment is expressed at probability of ‘5%’ it means that The null hypothesis is true 5% of the number of times the experiment is conducted.
- Kruskal Wallis Test is more appropriate in there are more than two groups and the distribution in each group is not normal.
- Two groups(Control, treated) are to be compared to test the effect of a treatment. Some individuali variability is high in both groups, The appropriate statical test to use is Mann-Whitney U test
Learn More: Biostatistics Practice Test
Tags:
methods in biology


